|
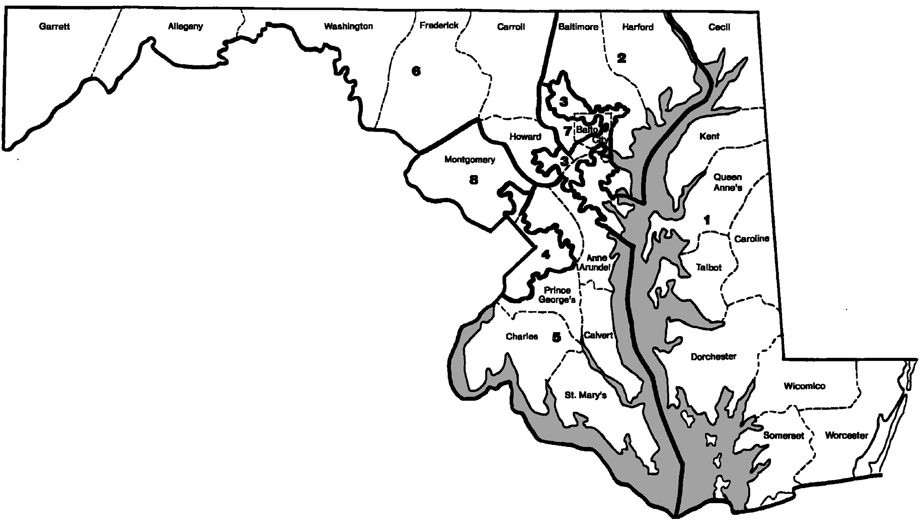
2002 Congressional
District Statistics
|
1 - 2 -
3 - 4 -
5 - 6 -
7 - 8
District 1
| County |
Population |
White |
Black |
Asian |
Hispanic |
| Anne Arundel (part) |
101,514 |
94,005 |
4,304 |
2,011 |
1,514 |
| Baltimore County (part) |
58,678 |
54,550 |
1,178 |
2,555 |
697 |
| Caroline |
29,772 |
24,322 |
4,577 |
212 |
789 |
| Cecil |
85,951 |
80,272 |
3,664 |
768 |
1,306 |
| Dorchester |
30,674 |
21,302 |
8,861 |
244 |
385 |
| Harford (part) |
105,967 |
99,561 |
3,480 |
2,077 |
1,301 |
| Kent |
19,197 |
15,288 |
3,422 |
130 |
546 |
| Queen
Anne's |
40,563 |
36,120 |
3,696 |
355 |
444 |
| Somerset |
24,747 |
13,949 |
10,323 |
169 |
334 |
| Talbot |
33,812 |
27,720 |
5,313 |
327 |
615 |
| Wicomico |
84,644 |
61,438 |
20,334 |
1,715 |
1,842 |
| Worcester |
46,543 |
37,791 |
7,972 |
362 |
596 |
| District 1 Totals |
662,062 |
566,318 |
77,124 |
10,925 |
10,369 |
District 2
| County |
Population |
White |
Black |
Asian |
Hispanic |
| Anne Arundel (part) |
107,337 |
79,272 |
21,978 |
3,664 |
3,543 |
| Baltimore County (part) |
359,711 |
268,889 |
73,781 |
12,004 |
6,539 |
| Baltimore
City (part) |
111,715 |
35,530 |
73,302 |
1,439 |
1,718 |
| Harford (part) |
83,297 |
61,918 |
17,455 |
1,958 |
2,648 |
| District
2 Totals |
662,060 |
445,609 |
186,516 |
19,065 |
14,448 |
District 3
| County |
Population |
White |
Black |
Asian |
Hispanic |
| Anne Arundel (part) |
231,799 |
179,976 |
39,929 |
7,720 |
7,124 |
| Baltimore County (part) |
185,400 |
154,255 |
21,675 |
6,970 |
3,978 |
| Baltimore
City (part) |
168,687 |
123,718 |
36,327 |
3,896 |
5,309 |
| Howard (part) |
76,176 |
53,591 |
15,122 |
5,807 |
2,802 |
| District
3 Totals |
662,062 |
511,540 |
113,053 |
24,393 |
19,213 |
District 4
| County |
Population |
White |
Black |
Asian |
Hispanic |
| Montgomery (part) |
251,258 |
148,374 |
55,276 |
30,482 |
28,343 |
| Prince George's (part) |
410,804 |
52,324 |
333,732 |
11,234 |
21,460 |
| District
4 Totals |
662,062 |
200,698 |
389,008 |
41,716 |
49,803 |
District 5
| County |
Population |
White |
Black |
Asian |
Hispanic |
| Anne Arundel (part) |
49,006 |
44,536 |
3,468 |
431 |
721 |
| Calvert |
74,563 |
62,578 |
10,128 |
906 |
1,135 |
| Charles |
120,546 |
82,587 |
32,676 |
2,884 |
2,722 |
| Prince George's
(part) |
331,734 |
150,290 |
149,109 |
22,113 |
16,594 |
| St. Mary's |
86,211 |
70,320 |
12,540 |
2,044 |
1,720 |
| District
5 Totals |
662,060 |
410,311 |
207,921 |
28,378 |
22,892 |
District 6
| County |
Population |
White |
Black |
Asian |
Hispanic |
| Allegany |
74,930 |
69,702 |
4,289 |
497 |
571 |
| Baltimore County
(part) |
30,861 |
29,445 |
583 |
588 |
255 |
| Carroll |
150,897 |
144,399 |
3,764 |
1,445 |
1,489 |
| Frederick |
195,277 |
174,432 |
13,605 |
4,066 |
4,664 |
| Garrett |
29,846 |
29,496 |
152 |
71 |
131 |
| Harford (part) |
29,326 |
28,199 |
737 |
163 |
220 |
| Montgomery (part) |
19,000 |
17,262 |
903 |
456 |
657 |
| Washington |
131,923 |
118,348 |
10,879 |
1,301 |
1,570 |
| District
6 Totals |
662,060 |
611,283 |
34,912 |
8,587 |
9,557 |
District 7
| County |
Population |
White |
Black |
Asian |
Hispanic |
| Baltimore County
(part) |
119,642 |
53,993 |
59,329 |
4,795 |
2,305 |
| Baltimore City
(part) |
370,752 |
46,734 |
314,820 |
6,515 |
4,034 |
| Howard (part) |
171,666 |
130,624 |
23,308 |
15,084 |
4,688 |
| District
7 Totals |
662,060 |
231,351 |
397,457 |
26,394 |
11,027 |
District 8
| County |
Population |
White |
Black |
Asian |
Hispanic |
| Montgomery (part) |
603,083 |
400,083 |
86,328 |
76,847 |
71,604 |
| Prince George's
(part) |
58,977 |
14,115 |
32,717 |
2,103 |
19,003 |
| District
8 Totals |
662,060 |
414,198 |
119,045 |
78,950 |
90,067 |
SOURCE: Maryland Department of Planning, Planning Data
Services
Top of Page | Home Page
Published 05/16/02; Last updated: 05/16/02 05:05 PM
Copyright © 2 002 University of Maryland College of Journalism. All rights reserved.
Reproduction in whole or in part without permission is prohibited.
|
|

Main Page
|

Congressional
Maps
|

Legislative
Maps
|

Timeline
|

Quiz
|

Related Links
|
|
